Learn to Read a Histogram to Help You
Get the Proper Exposure
Exposure is a major factor to decide whether a photo is good or not. But simply by checking the exposure with your eyes on the camera’s monitor are not 100% reliable, as both can go wrong sometimes. Histogram is a quantitative method to help you determine the exposure level of a photo. So let’s learn how to read it!
How to Read a Histogram
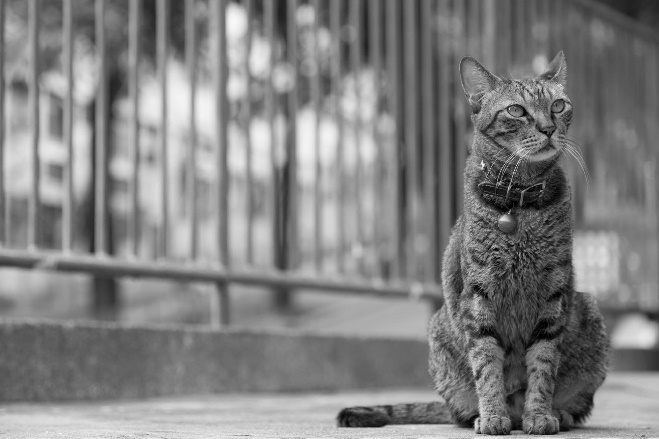
For the ease of understanding a Histogram, we can first convert the photo into black & white. The darker areas are blacks and the brighter areas are whites. The x-axis of the Histogram represents the darkest pixels and the brightest pixels from the left to right, while the y-axis represents the number of pixels. In general, the Histogram of an evenly exposed image will have a bell-shaped distribution, i.e. most of the pixels gather in the middle of the x-axis – the grey area between the darkest and the brightest.
Also, we should avoid having pixels on both sides of the x-axis, i.e. what we called “Crushed Blacks” and “Blown Out Whites”. Even if we are shooting RAW, it is still hard to recover the image details in the “Crushed Blacks” and “Blown Out Whites” areas.
Also, we should avoid having pixels on both sides of the x-axis, i.e. what we called “Crushed Blacks” and “Blown Out Whites”. Even if we are shooting RAW, it is still hard to recover the image details in the “Crushed Blacks” and “Blown Out Whites” areas.
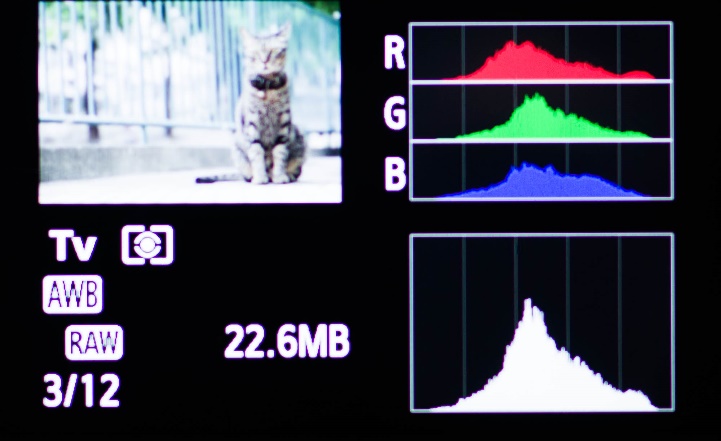
A Normally Exposed Histogram
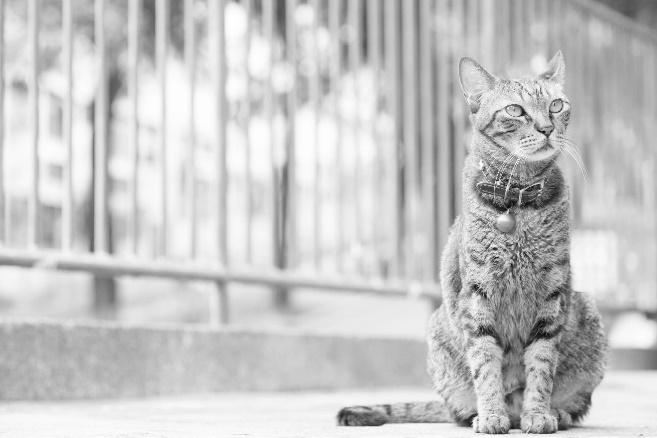
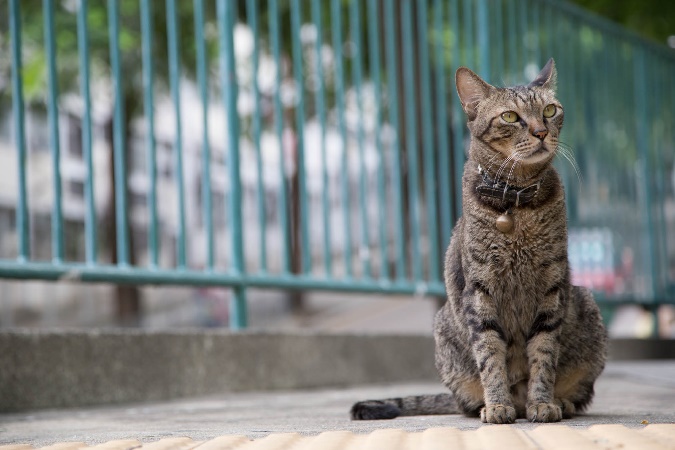
With pixels mainly appear in the middle of the x-axis, we can tell that the photo is evenly exposed without going over or under.
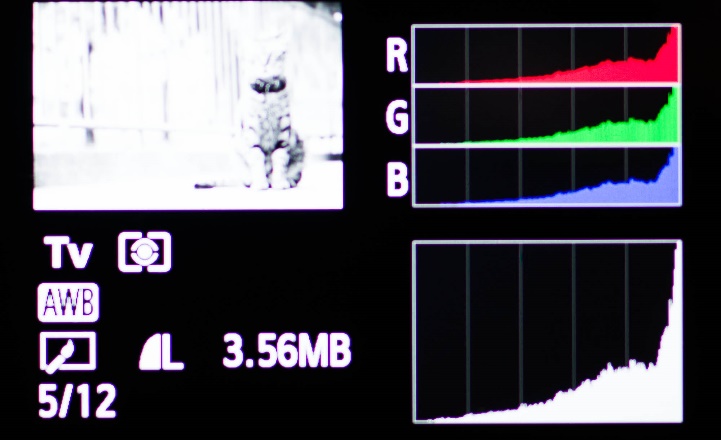
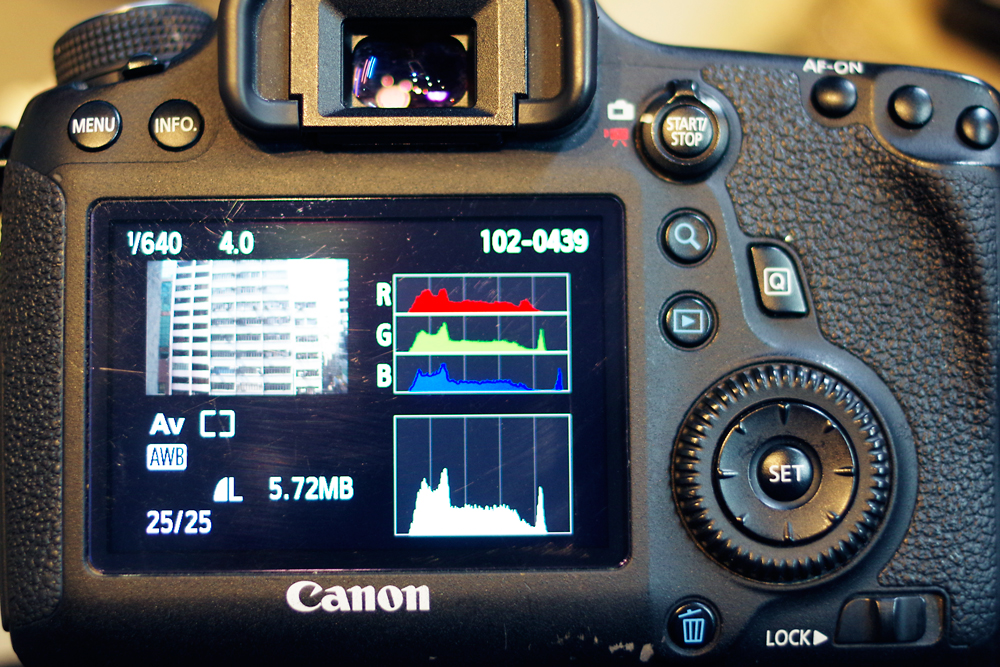
[Over-exposed]] With pixels appear mainly on the right side of the x-axis, we can tell that the photo contains a lot of overly bright pixels making it blown out in the highlights and over-exposed, in areas like the ground and the gaps between the barriers.
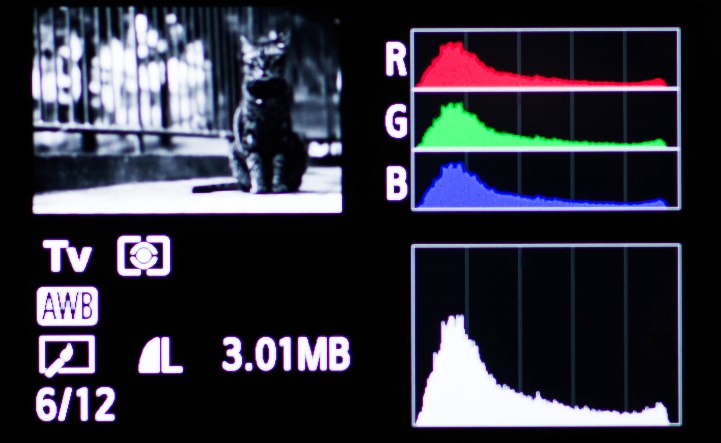
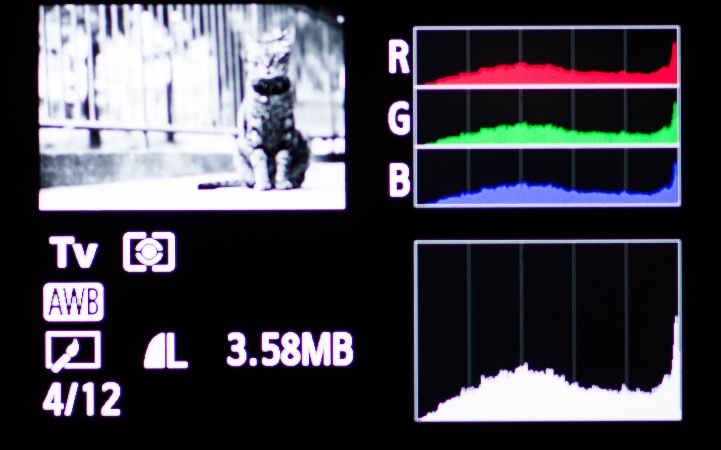
[Under-exposed] With pixels appear mainly on the left side of the x-axis, we can tell that the photo contains a lot of overly dark pixels making the shadows turn pure black. Overall, the photo is under-exposed.
With pixels appear mainly on the left side of the x-axis, we can tell that the photo contains a lot of overly dark pixels making the shadows turn pure black. Overall, the photo is under-exposed.
Exceptional Cases
Similar to judging a photo, there is no right or wrong in exposure level. It is very subjective. Therefore, the evenly exposed photo mentioned above does not necessarily mean it is a good photo.
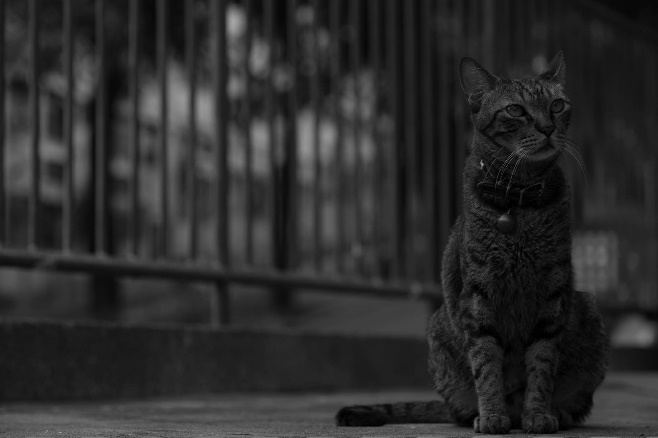
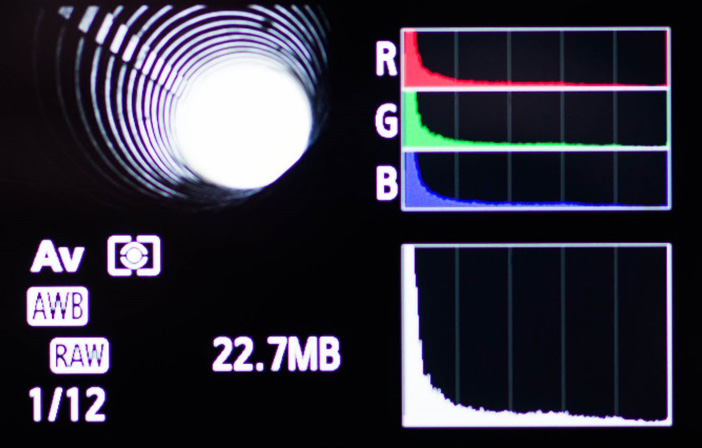
For example, the Histogram of the below photo has pixels distributed mainly on both sides of the x-axis, resulting in considerable amounts of pixels that are “Crushed Blacks” or “Blow Out Whites”. However, having a great contrast in brightness is the characteristics of this photo. It will ruin the aesthetics of this photo if we blindly adjust the exposure level.
For example, the Histogram of the below photo has pixels distributed mainly on both sides of the x-axis, resulting in considerable amounts of pixels that are “Crushed Blacks” or “Blow Out Whites”. However, having a great contrast in brightness is the characteristics of this photo. It will ruin the aesthetics of this photo if we blindly adjust the exposure level.
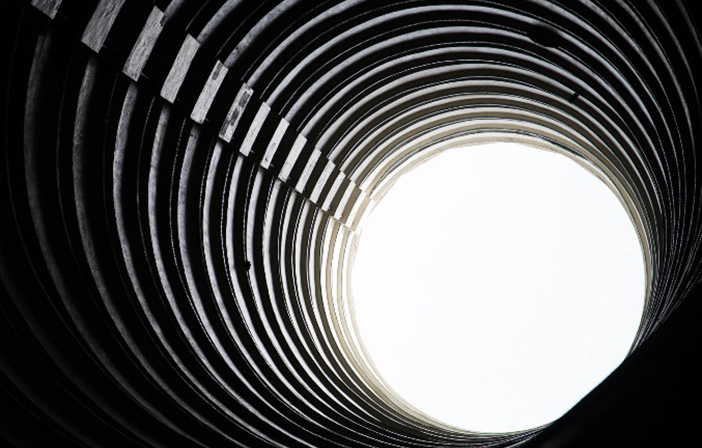
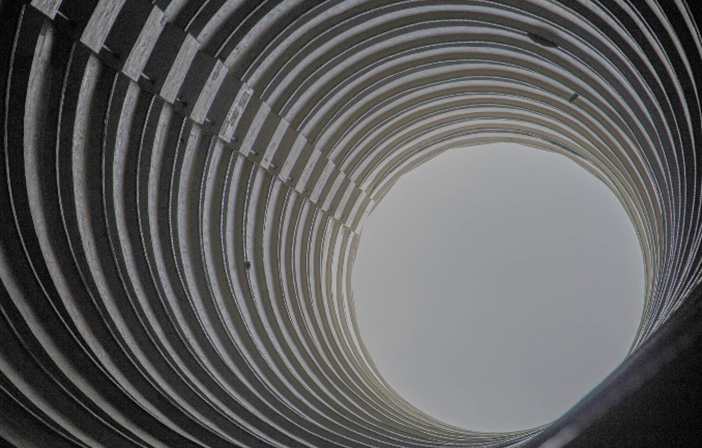
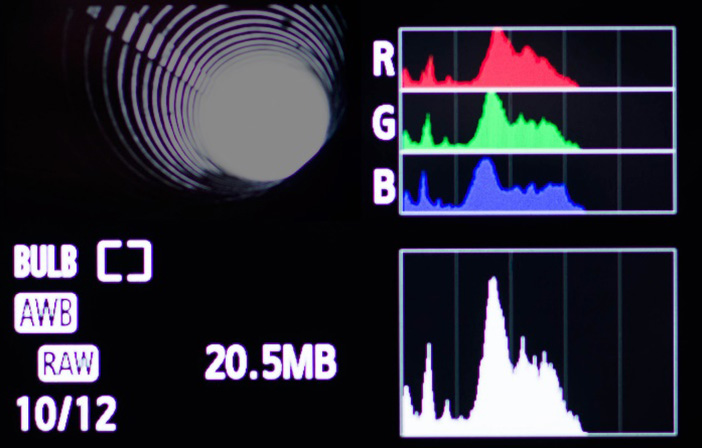
If we blindly adjust the exposure level just to make more pixels appear in the middle of the x-axis, the photo will look grey and lose the sharp contrast of dark and bright.
Here is another example that an abnormal looking Histogram is in fact totally fine. When the subjects we photograph are white (eg. snow) or black (eg. man in black outfit) in color, the corresponding Histograms will have pixels gather on either side of the x-axis. Similarly, photos will look grey if we blindly adjust the exposure level just to achieve a bell-shaped distribution.
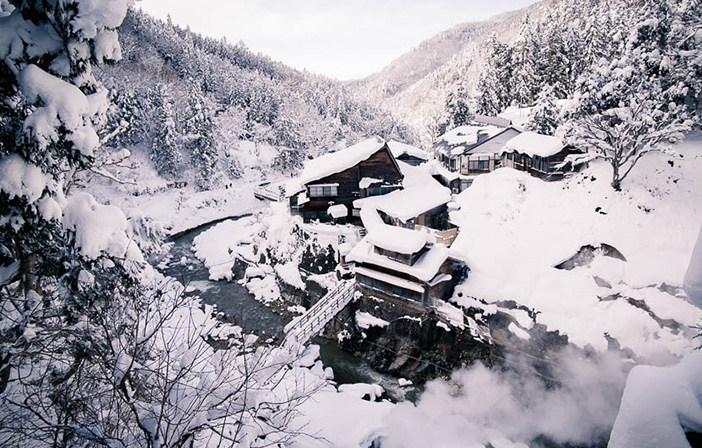
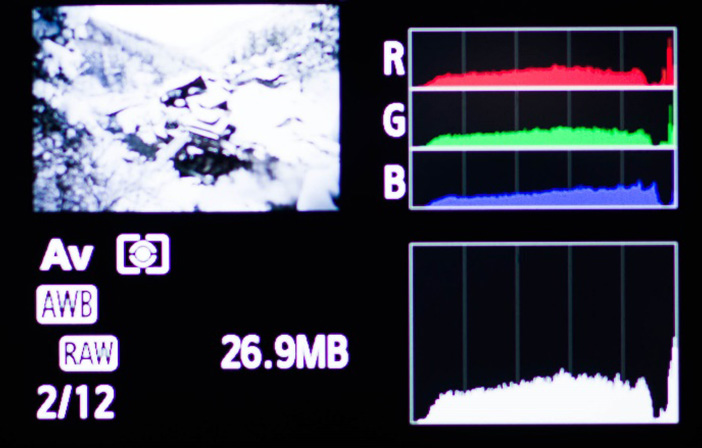
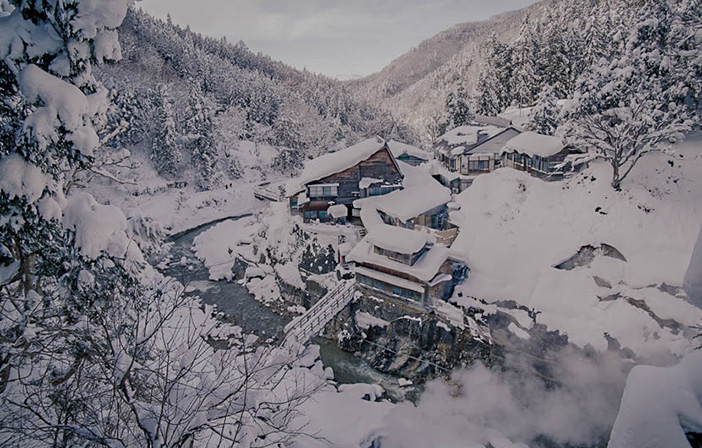
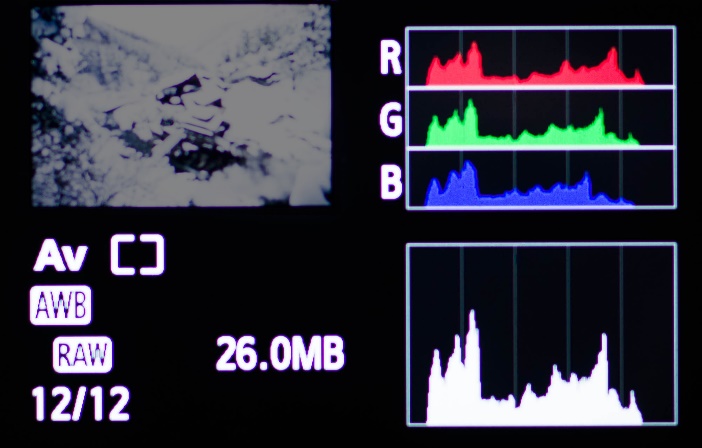
If we blindly adjust the exposure level just to make more pixels appear in the middle of the x-axis, the snow will look grey and the air will seem dusty and polluted in the photo.
Histogram is an objective and useful tool to help us determine the exposure level of a photo. But bear in mind that there is no absolute right or wrong about the pixel distribution. We have to take into account what kind of subjects we are dealing with in order to achieve the best distribution and create a stunning photo.